What is disease? A disease is a disorder of structure or function in a human, animal, or plant, especially one with a known cause and a distinctive group of symptoms, signs, or anatomical changes.
There is communicable disease and non-communicable disease: communicable disease can be transmitted from organism to organism by pathogens (viruses, bacteria, fungi or protists) while non-communicable disease does not get transmitted as a pathogen does not cause it, therefore, communicable disease should be modelled to eventually be eradicated. Modelling disease is carried out by structuring differential equations. Disease modelling has been used throughout the years. Disease modelling has been recently utilised with COVID-19, which started in December 2019, as well as all the way back in the years between 1870 and 1874 to eradicate smallpox. Differential equations are constructed to have a better understanding of the rate at which communicable disease is spread by describing the correlation between different variables (inputs and outputs) for the disease. This can help scientists understand how it will behave in the future so epidemiologists can make predictions and plan when lockdowns will need to be put in place and when it is safe for the preventive measures to be lifted.
Infectious disease modelling has helped to predict the behaviour of many diseases, and many others while two diseases were eradicated: smallpox and rinderpest. The simplest version of the basic model of disease is called the SIR model.

The parameter values represent different rates. β represents the infection rate, γ is the recovery rate and ξ is the rate at which people lose immunity.
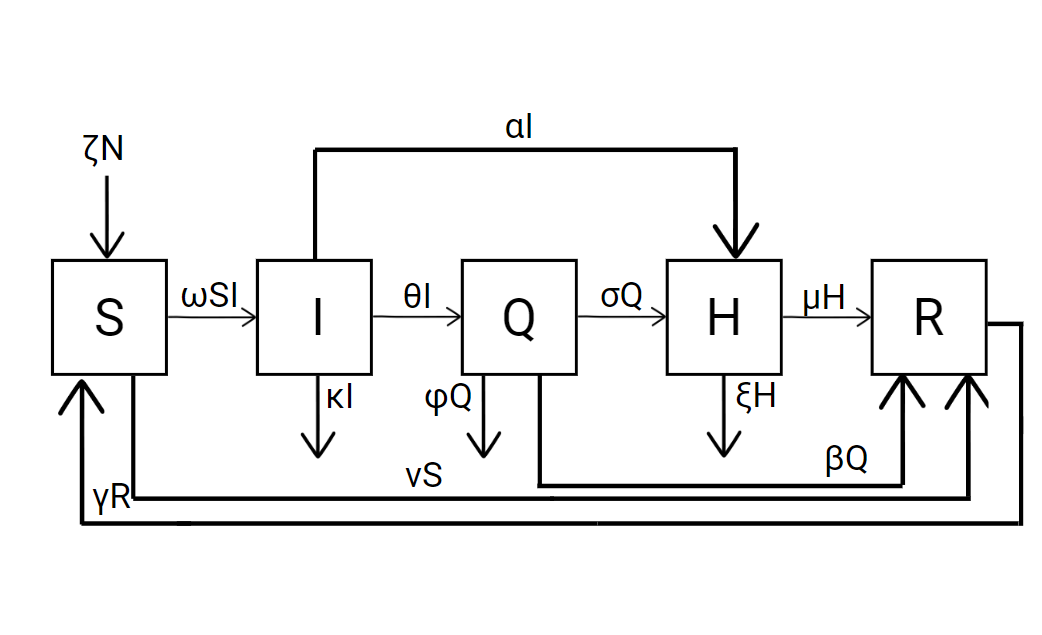
A slightly more elevated version of the SIR model is the SIQHR model:

The SIQHR model includes two new compartments: quarantined and hospitalised. It also contains new inputs and outputs that relate to COVID-19 called parameter values. The SIR model can be adapted to any disease.
The reproductive ratio is a value that tells us the number of people who may become infected given contact with an infected person. A disease-free state exists if R0≤1, so we have to adapt
R0=βN/γ
to make R0 equal to less than or equal to 1. β represents the infection rate, N is the number in the population and γ is the recovery rate. The strategies to make R0 small therefore getting a disease-free state include reducing the N. To do this, lockdowns could be introduced to reduce the number of the population exposed. It is also possible to increase the γ. To do this, it is necessary to provide better medication to treat the illness. The last way to make R0 small is to decrease β by putting people who are infected with the disease in quarantine, and/or introducing vaccinations.
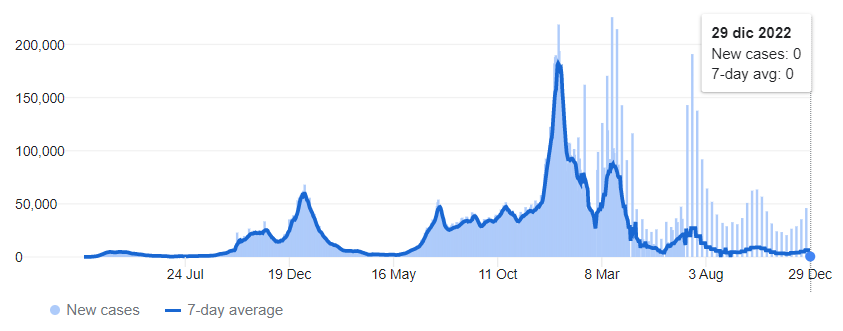
Vaccinations introduce the body to dead or inactive pathogens so the body knows how to remove them the next time it gets introduced to the same pathogen/virus. Vaccinations are a great way to make more people move from the compartment ‘susceptible’ to the compartment ‘recovered’ in the SIR model. Once they lose immunity, they go back to the ‘susceptible’ box, which is shown by ξ, which is why vaccinations need to be boosted regularly so people remain in the ‘recovered’ box. Vaccinations show improvements with the COVID-19 situation. It is shown with the graph showing COVID-19 cases in the UK:

This graph shows a steady state from around September until the end of December of 2022.

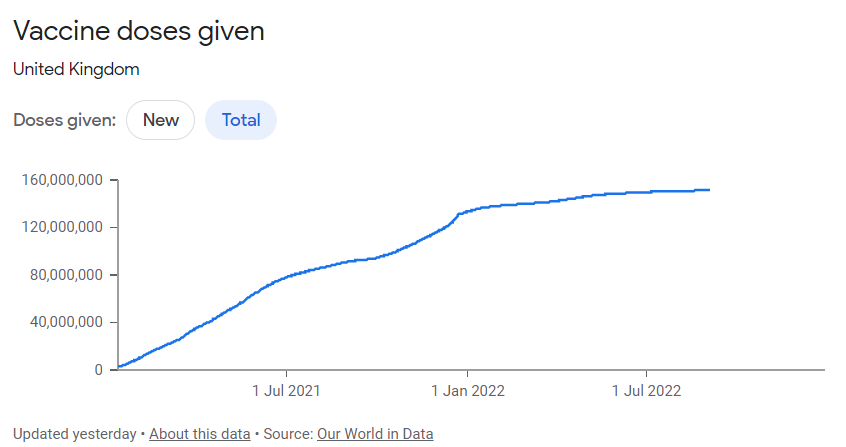
It can be implied that the reason for the steady state is that vaccination doses given increased substantially from the start of 2022 and boosters were also given more and more, making people in the UK maintain their immunity, driving them to stay in the ‘recovered’ compartment. The decision to introduce vaccinations was made because of infectious disease modelling for COVID-19.
On the other hand, infectious disease modelling isn’t always as reliable as it could be. With infectious disease modelling come doubts as to making sure all the data is correct and reliable, which is very unlikely. Another uncertainty would be that even with all the correct and timely data, predictions may still be unreliable, as predictions are very rarely entirely accurate. Also, infectious disease modelling doesn’t take into account stochastic events which makes it partly inaccurate. Another factor includes the fact that not everyone is included in the data. In the case of COVID-19, asymptomatic people are not included in the data as most don’t know they have the disease. Some people may also mistake the symptoms of COVID-19 as symptoms of influenza or the common cold. All of this may lead to inaccurate parameter values.
In terms of COVID-19, I believe that infectious disease modelling has played a vital role throughout society for many years. Looking at the example of smallpox and rinderpest, I believe they would not have been eradicated without mathematical infectious disease modelling. Future mathematical modelling will be essential to deepen our knowledge of infectious diseases and will help scientists to tackle pandemics in the future as it proved to have been crucial in our current pandemic to decide when to introduce lockdowns and lift them by, for example, making the R0 value less or equal to 1. Vaccinations played a big role in suppressing the COVID-19 global pandemic. The decision to produce vaccinations has been taken due to the mathematical modelling of infectious diseases. The efficacy of the COVID-19 vaccinations is shown by the Google News statistics showing how COVID-19 cases substantially decreased from the start of 2022, which is around the time when vaccination doses increased significantly. This shows how infectious disease modelling has greatly impacted the behaviour of COVID-19 and explains the significant short time from the first confirmed case to the time it took to immunise 50% of the global population (1 year) compared to Polio (80 years). (Gates, 139)
Works Cited
Gates, Bill (William) Henry. “Get ready to make vaccines.” How to prevent the next pandemic, 2022, p. 139.
Google News. “The shorter side of =.” YouTube, 25 October 2021, https://news.google.com/covid19/map?hl=en-GB&mid=%2Fm%2F07ssc&gl=GB&ceid=GB%3Aen. Accessed 30 December 2022.
Google News. “The shorter side of =.” YouTube, 25 October 2021, https://news.google.com/covid19/map?hl=en-GB&mid=%2Fm%2F07ssc&gl=GB&ceid=GB%3Aen&state=3. Accessed 30 December 2022.
IDM. “SIR and SIRS models — Generic Model documentation.” IDM docs, 21 May 2022, https://docs.idmod.org/projects/emod-generic/en/2.20_a/model-sir.html. Accessed 28 December 2022.


